oMeds
Biomarker Intelligence · Provider-reviewed

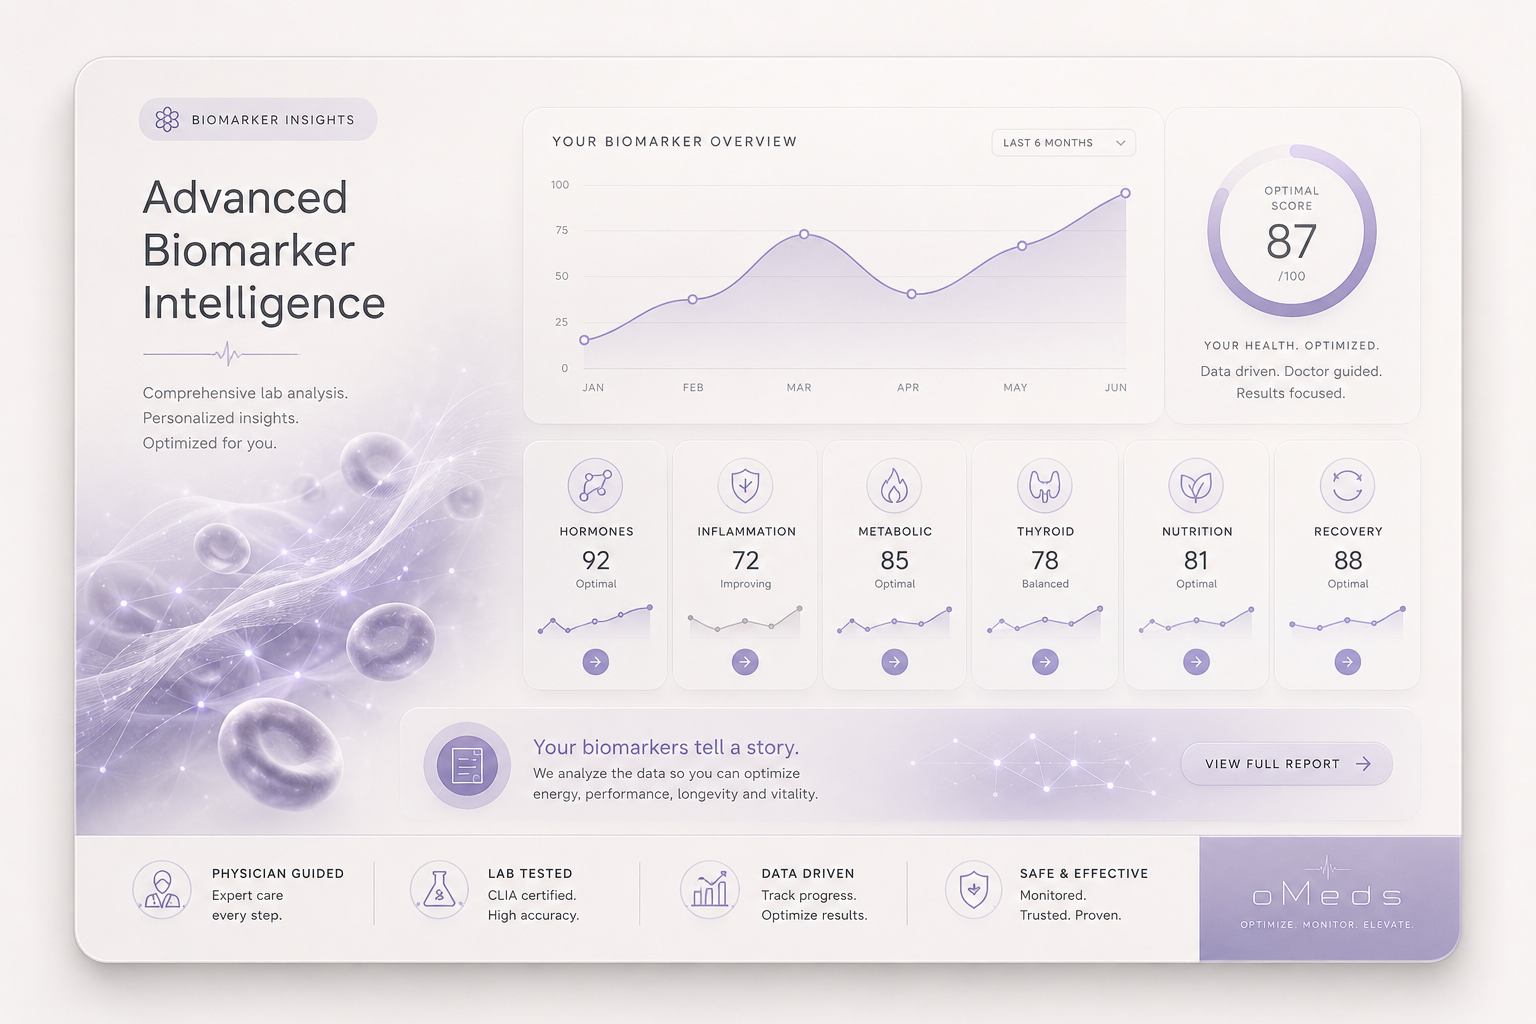
Your biomarkers tell a bigger story.

Explore the lab markers commonly reviewed to give deeper context around metabolism, hormones, thyroid, inflammation, cardiovascular health, recovery, and long-term optimization — interpreted by a licensed clinician.

100 markers500+ reviewed relationshipsOne licensed clinician interpreting yours
OMEDS · Health Intelligence OS
v2026.5
Biological Performance Index
76/ 100
Metabolic78
Recovery71
Hormones84
Cardiovascular82
500+ relationships analyzedProvider-reviewed
Why patterns matter

Most lab reports show numbers. This page helps explain the patterns.

A single value is one signal. Patterns across systems — interpreted in context by a licensed provider — are where biomarkers become meaningful.

Pattern recognition

Markers move together. See the relationships.

Two physiological loops you can explore. Tap any marker to highlight the markers it's commonly reviewed alongside — and why.

Tap a marker to highlight its relationships

ContextHow glucose, insulin, and lipids move together.

Explore the panel

Educational visualization of commonly co-reviewed markers. Not a diagnosis. Lab values are interpreted by a licensed clinician alongside symptoms, history, and goals.

Biomarker intelligence map

Explore biomarkers by the system you want to understand.

Eleven physiological domains, organized for how clinicians actually review them. Select a category to jump into the library.

An abstract constellation of biomarker nodes connected by delicate filaments
Figure 01 · The signal network
Every marker · A relationship

No biomarker tells the whole story. The pattern does.

One reading is a coordinate. Twelve, reviewed together, draw a map — of recovery, resilience, and where a system is trending well before a flag appears.

Most-discussed biomarkers

Twelve markers reviewed across most optimization conversations.

Featured markers carry the highest signal density across metabolic, hormonal, cardiovascular, inflammatory, and recovery systems.

Swipe · 12 markers
What a reading looks like

Two bands. One number. A different conversation.

A live, illustrative preview of how a single biomarker is read in conventional vs optimization context — and the markers it's reviewed alongside. Educational sample only.

Hormones

Total Testosterone

412ng/dL

Most recent reading · 02 May 2026

Reviewed alongside

  • Free T
  • SHBG
  • LH
  • Estradiol
Conventional reference rangeFlags pathology

Within the conventional reference range. No pathology flagged.

Optimization-context bandLooks earlier

Reading sits in the lower third of an optimization-context band. A provider may also weigh symptoms, SHBG, free T, and trend before any recommendation.

Clinician note · Reading reviewed in context of symptoms, recovery, and the related markers above. Educational sample — your interpretation is performed by a U.S.-licensed clinician on your panel.

Optimal vs Conventional

Conventional ranges flag disease. Optimization-context looks earlier.

Reference ranges are designed to detect pathology. A provider conducting optimization-focused review may also weigh trends, symptoms, recovery, and where in the band a member sits.

Optimal vs Conventional

ApoB

mg/dL

ApoB counts atherogenic particles. A 'normal' read by disease-detection thresholds may still leave long-horizon cardiovascular signal on the table.

Conventional reference< 130
Optimization-context< 80
Optimal vs Conventional

Free Testosterone

pg/mL

Conventional ranges span decades of age groups. Optimization-focused review often weighs symptoms, recovery, and where in the band a member sits.

Conventional reference47 – 244
Optimization-context100 – 180
Optimal vs Conventional

Vitamin D 25-OH

ng/mL

Sufficiency by lab cutoff is the disease-prevention floor. Many providers consider a tighter band when reviewing energy, immune, and metabolic context.

Conventional reference30 – 100
Optimization-context50 – 80

Conventional ranges exist for a reason — they're designed to flag disease. Optimization-context bands are framing only, not a diagnosis. Every reading is interpreted by a licensed clinician alongside symptoms, history, medications, and goals.

Order biomarker panel
The biomarker intelligence library

The biomarkers behind every signal — in plain language.

A curated reference of the 100 markers that power the intelligence layer above. Featured markers carry a gold star. Educational only — every reading is interpreted by a licensed clinician.

Most reviewed · featured

The twelve markers carrying the highest signal density.

Metabolic system

Hormones system

Thyroid system

Cardiovascular system

Inflammation system

  • Standard biomarker panel · Optional

    Bring this library to life — with your numbers.

    Hormones · Lipids · CBC · CMP. Mail-home collection, two-way shipping included, provider-reviewed result summary. $149, never required.

  • Nutrients system

    Liver system

    Kidney system

    CBC system

    Performance & Recovery system

    Longevity system

  • Why interpretation matters

    A value is a signal. Provider review is the context.

    Every reading you explore here becomes clinically useful only when interpreted by a licensed clinician alongside symptoms, history, and goals.

  • Signal architecture

    Biomarkers don't exist in isolation — they form a network.

    Every value is interpreted against the systems it interacts with. Patterns emerge that a single number can never reveal.

    Signal architecture · Live relationships

    500+ physiological relationships analyzed

    MetabolicHormonesThyroidCardiovascularInflammationRecoveryNutrients
    TestosteroneEstradiolFree T3TSHFasting InsulinHbA1CApoBLp(a)hs-CRPFerritinVitamin DCortisol

    Biomarkers don't exist in isolation. Every value is interpreted against the cardiovascular, metabolic, hormonal, inflammatory, and recovery systems it interacts with — surfacing the patterns a single number can never reveal.

    Longitudinal intelligence

    Optimization is a trajectory, not a single number.

    Each biomarker is tracked over time against personalized optimization targets — surfacing direction, velocity, and physiological response.

    Provider review · The bridge from data to context

    Biomarkers are data. Provider review creates context.

    A biomarker rarely tells the entire story by itself. Provider review connects lab values with symptoms, history, medications, goals, physiology, and overall health context.

    Understand the numbers behind your health.

    Explore biomarker education and learn how structured provider review helps create deeper physiological context. Educational only — lab values are interpreted by a licensed clinician alongside symptoms, history, and goals.